The Persistence of Vision Ray Tracer or POV-Ray is an open source free ray tracing rendering engine that uses a special text based scene description language for modeling and rendering objects. Unlike many CAD programs that use triangle meshes to define it shapes, POV-Ray uses mathematical formulas to define its primitive shapes. In addition to traditional primitive objects such as sphere, box, and torus it includes blobs, fractals and polynomial based objects. It does also support creating objects out of triangle meshes but there’s no way to convert other POV-Ray objects into triangle meshes. If you want to 3-D print an object you’ve designed in POV-Ray or transfer it to some other CAD program that only supports meshes there’s no surefire way to do that.
POV-Ray does give you the ability within its scene description language to fire a ray at any object and determine its intersection point and surface normal at that point. We can use this feature to fire rays at an object in a grid and create a set of points called a “point cloud”. These points can be output to a text file and then imported into other software that will create a triangle mesh based on this collection of points. This method is not useful for exporting an entire scene with many objects and lots of details. But if you have one of those organic blob, fractal, or polynomial primitive shapes that you want to convert to a mesh it does give you a reasonably accurate representation of the original shape.
We have created a set of macros called “pov2mesh” that automates this process for you. In this tutorial we will describe how to use this software along with other free programs to scan a POV-Ray object, create a set of points, and convert it to STL files suitable for import into other modeling software and eventual 3-D printing.
The part of the process is the POV-Ray vector function “trace” which is used as follows:
   #declare Norm=<0,0,0>;
   #declare Hit=trace(Object,Location,Direction,Norm);
   #if(vlength(Norm))
      #debug concat(vstr(3, Hit, " ",0,6), "\n")
   #end
The function returns a three element vector containing the XYZ coordinates of where the ray hits. You pass it the object you want to trace, the initial location, the direction of the ray, and a vector variable that it will use to return the surface normal. You have to pre-initialize a vector for the surface normal. The function modifies that parameter to return the value. If the length of that normal vector is zero then the ray did not hit. If the length is nonzero we then output the values to a text file using the #debug statement. Each point is output to a single line separated by spaces.
The macros we are supplying use this code to fire rays at your object in a grid pattern of parallel rays. We also have a cylindrical pattern which we will describe later. The grid macro is as follows:
Grid_Trace(Object,StartR,EndR,DeltaR,DirR,
           StartC,EndC,DeltaC,DirC,CamL,CamD,DotR)
The first parameter is the object you want to scan. The scan is done in rows and columns. You specify the start coordinate of the row, the end coordinate, the increment or delta value that is the distance between the rows, and the direction of the row. This is followed by the start, end, delta, and direction of the columns. If you want to visualize where the hit occurs the final parameter is the radius of a tiny sphere which will be rendered at the intersection point. If you pass zero then the spheres are not created. Here is an example of how you would invoke this macro:
Grid_Trace(My_Object,-3,3,0.25,y, -4,4,0.25,x, -10*z,z, 0.1)
This uses rows in the Y direction from -3 to +3 in 0.25 increments. It goes from -4 to +4 and 0.25 increments in the x direction. The ray starts at -10*z and is emitted in the +z direction. The radius of the dots is 0.1.
The trace function only gives you the first hit where the ray intersects the object. Therefore it is generally necessary to fire the rays from multiple directions. We also provide a cylindrical pattern that you would invoke as follows:
Cyln_Trace(Object,StartR,EndR,DeltaR,DirR,
           StartH,EndH,DeltaH,DirH,CamL,CamD,DotR)
The second through fifth parameters are the starting angle of rotation, ending angle, the increment in degrees, and the direction of rotation. The next four parameters the start, end, increment, and direction of the height of the cylindrical scan. The other parameters are as with the grid trace version of the macro. Here is a typical way to invoke it.
Cyln_Trace (My_Object,0,360,2,y, -4,4,0.25,y, 10*x,-x, 0.1)
This does a cylindrical scan going from 0 to 360 degrees rotating about the y-axis in 2 degree increments. It goes from -4 to +4 along the y-axis in 0.25 increments. The ray starts out at location 10*x and points inwards in the -x direction. That location is what’s rotated. If you wanted to scan from the inside out those parameters would be <0,0,0>,x which would put the camera on the origin and point outward in the +x direction.
We also give you a combination macro which will fire rays from the top, bottom, left, right, front, and back as well as cylindrical scans outside in and inside out. It is defined as follows:
All_Trace (Object,GridMin,GridMax,Deltas,DeltaAng,Dot)
The parameters GridMin and GridMax are vectors defining the bounds of the area to be scanned. Deltas is the increment for grid scan and DeltaAng is the increment in degrees for the cylindrical scans. You would invoke it as follows:
All_Trace (Object,<-3,-4,-3>,<3,4,3>, 0.25,2, 0.1)
You can download the sample code from GitHub at the following link. https://github.com/cyborg5/pov2mesh It contains three files. The first file “test_platform.pov” is a standard camera and lighting system that I use when testing objects. The file “pov2mesh.pov” contains the macros. Finally there is a sample scene “blob.pov” using blob shapes that we will use to illustrate the process of converting the data into a mesh. Here is that scene:
#declare test_cam_loc=<20,20,-50>;
#include "test_platform.pov"
#include "pov2mesh.pov"
#declare Strength = 1.0;
#declare Radius1  = 1.0;

#declare My_Object=
   blob{
     threshold 0.6
     sphere{< 0.75,  0,   0>, Radius1, Strength scale <1,1,0.5>}
     sphere{<-0.375, 0.65,0>, Radius1, Strength}
     sphere{<-0.375,-0.65,0>, Radius1, Strength}
     scale 5
     pigment{rgb<1,0,0>}
   }

object {My_Object}
All_Trace(My_Object,<-6,-6,-6>,<6,6,6>,0.2,2,0.05)
background {rgb 1}
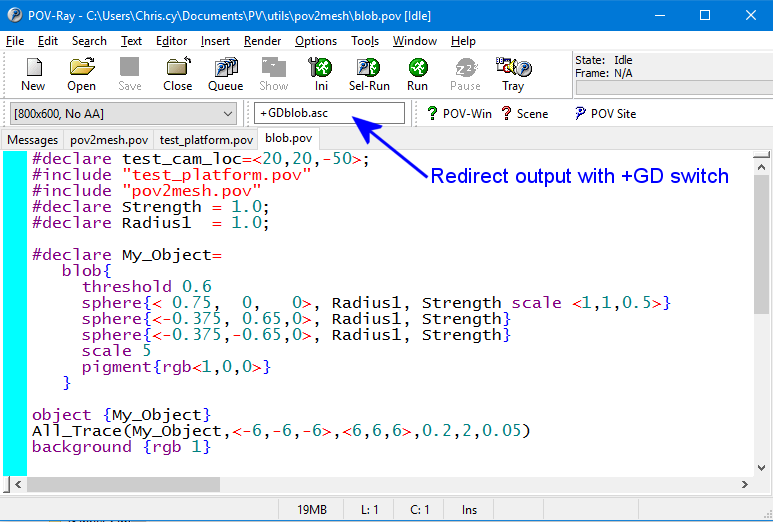
You should render this scene and redirect the debug output to a text file using the following command line switch “+GDblob.asc”. The “.asc” extension is simply an ASCII text file which we will import to a free program called Mesh Lab. Here is where you put the switch to redirect the output.
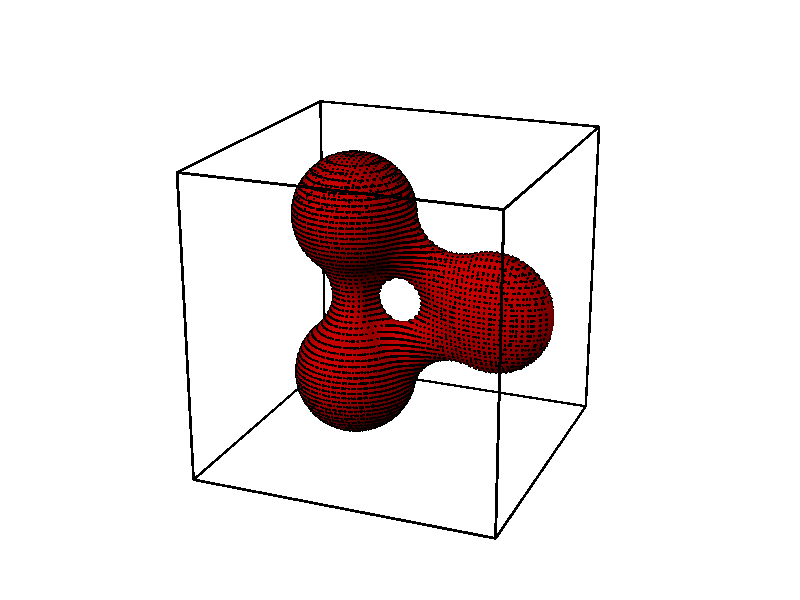
Here is the image created which shows you the dots on your object. The box around the object illustrates the minimum and maximum areas for the grid scan. We don’t really need the image that was rendered. We are only interested in the text file containing the points.
This is an example of a few lines of the file we created.
-4.200000 -3.600000 -0.327045
-4.200000 -3.400000 -0.454927
-4.200000 -3.200000 -0.476401
-4.200000 -3.000000 -0.408605
-4.200000 -2.800000 -0.164190
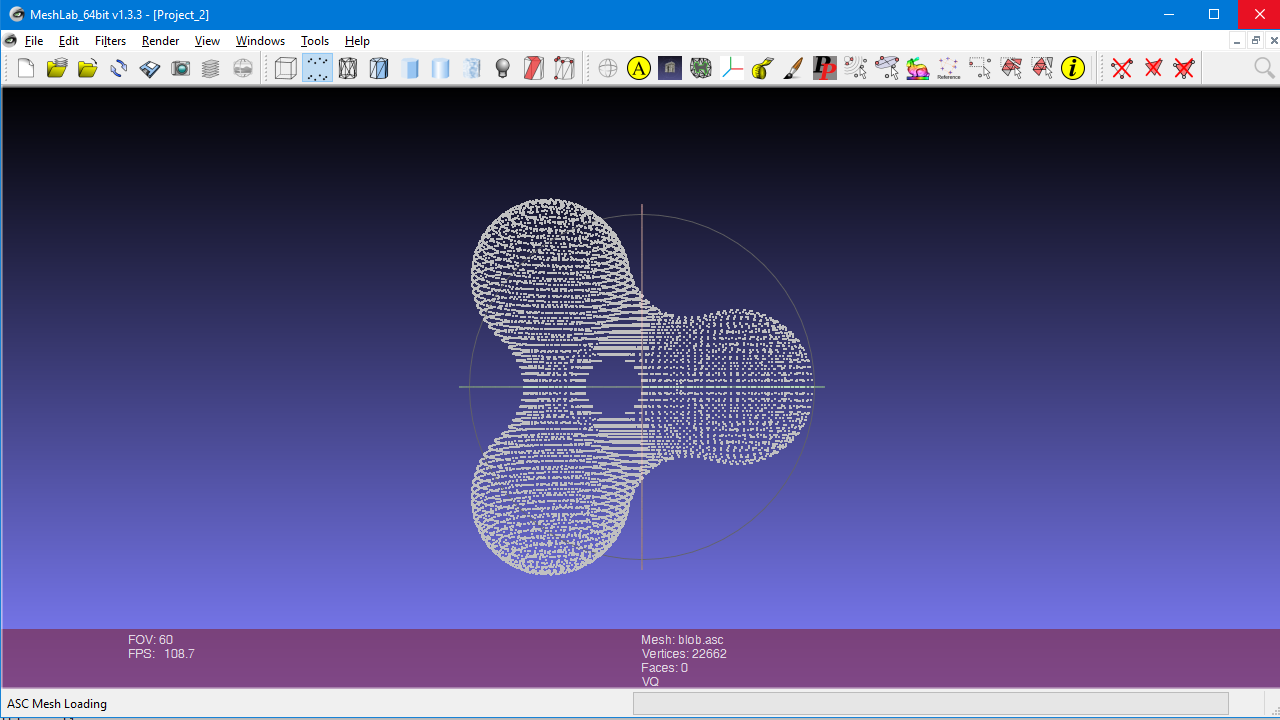
We will now import this file into Mesh Lab. It is a free program available on multiple platforms which you can download here. http://meshlab.sourceforge.net/ You can click on the images
throughout this blog to see larger versions. Open Mesh Lab and click on the File -> Import Mesh menu. A small dialog box will open and you should use the default settings. You will then see the point cloud you have imported.
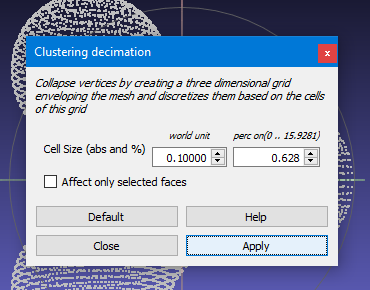
Because our scanning method could have produced identical points or points that were extremely close to one another we need to filter them out using a “Clustering Decimation” filter. You should click on the menu Filter-> Remeshing, Simplification and Reconstruction-> Clustering Decimation item. A dialog box will pop up and you should enter a number in the first field “Cell Size”. I recommend entering a world unit of 0.1 which means that any points which are closer together than 0.1 units will be combined into an average location of a single point. This value should be equal to or perhaps less than the increments you used when creating the scan of points in POV Ray. You also have an alternative percentage value that you can set if you would rather do it that way. You then click on the “apply” and “close” buttons.
 |
 |
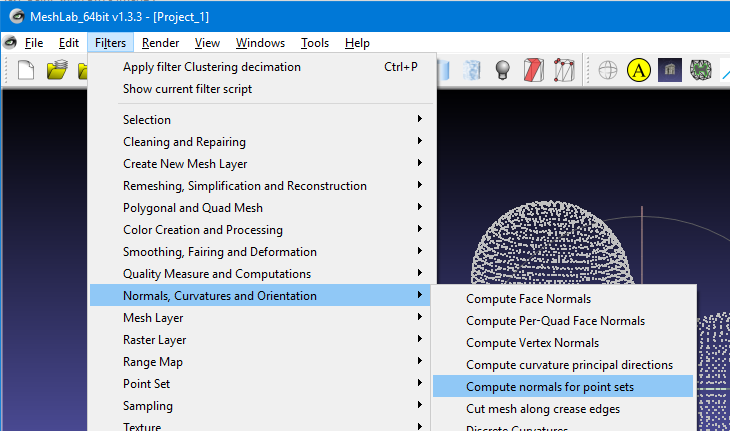
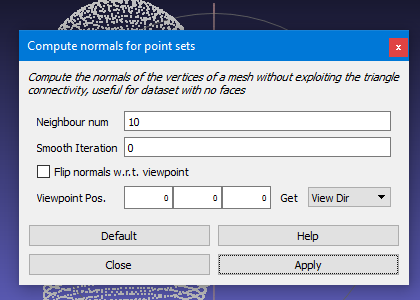
Next we need to compute the normal for each of the vertices. Although the POV Ray “trace” function gave us the normal, we have not yet figured out how to import that information into Mesh Lab. Click on the menu Filter-> Normals, Curvatures and Orientation-> Compute normals for point sets. You can use the default settings in this dialog box. Click on the “apply and “close” buttons.
 |
 |
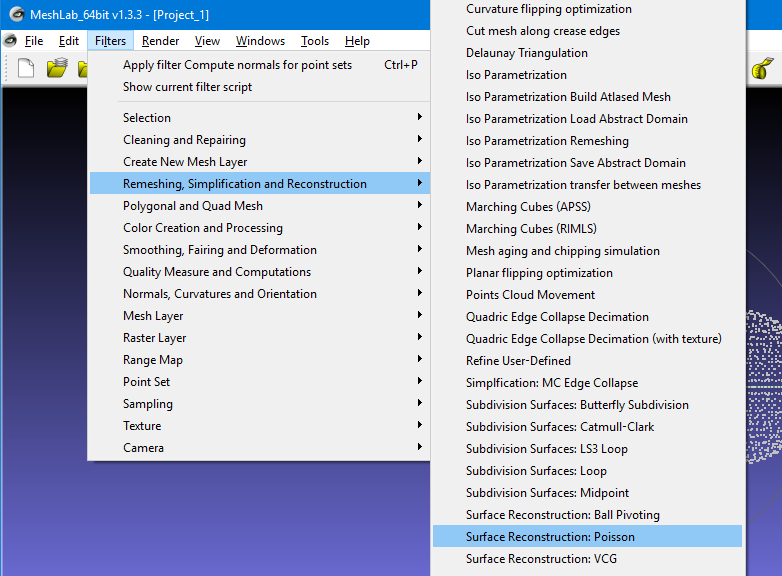
We are now ready to actually construct the faces of the mesh using the points. On the menu select Filter->Remeshing, Simplification and Reconstruction-> Surface Reconstruction Poisson. Note that there are two other methods of surface reconstruction available. The others are “Ball Pivoting” and “VCG”. To be honest I don’t understand what any of these three options mean. The Poisson method was recommended by a website I found and it works for me so I use it. You can probably use the default settings in the dialog box that pops up. Again I’m not really sure what these values do. At times I’ve tried experimenting by increasing the first two values from the 6 to 8 and the samples from 1 to 2 and at times it gave me slightly better results. Or you can just click on “apply” and “close”.
 |
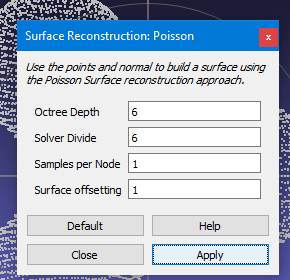 |
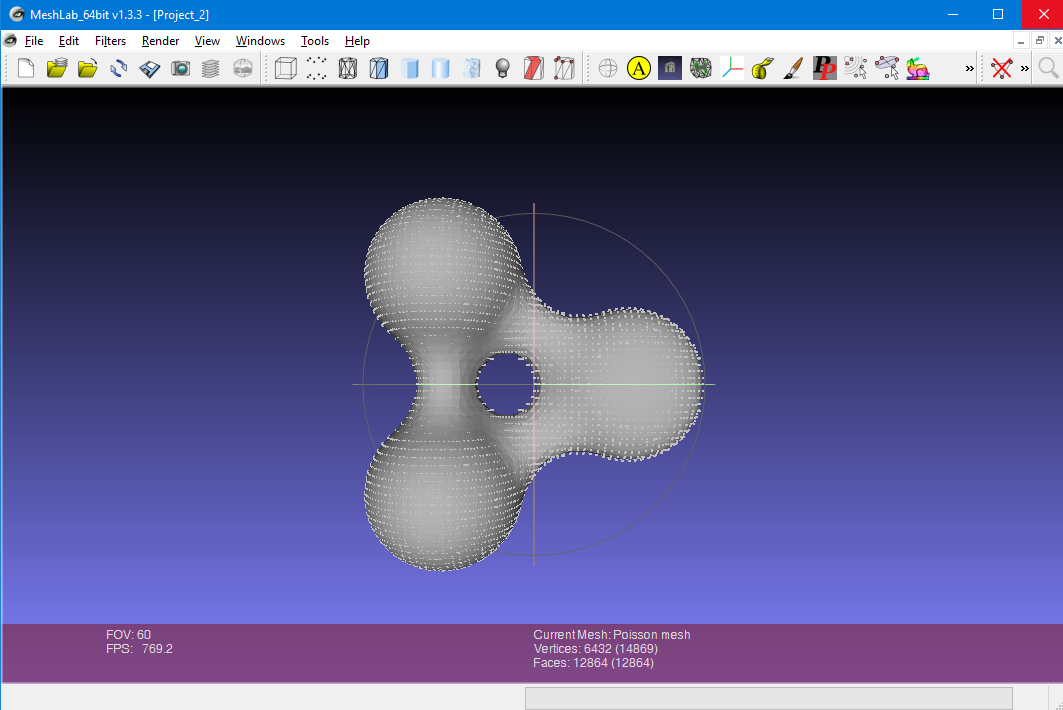
You should now see your object shaded gray like the image below.
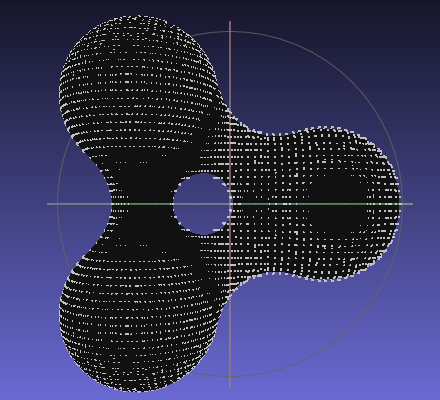
However if it comes out very dark or black like the image below, it means that the service normals of the faces somehow got inverted and we need to force them to flip over.
To invert the face normals use the menu Filters-> Normals, Curvatures and Orientation-> Invert Faces Orientation. Use the default values on the dialog box and make sure that “Force Flip” is checked. Click on “apply” and “close”.
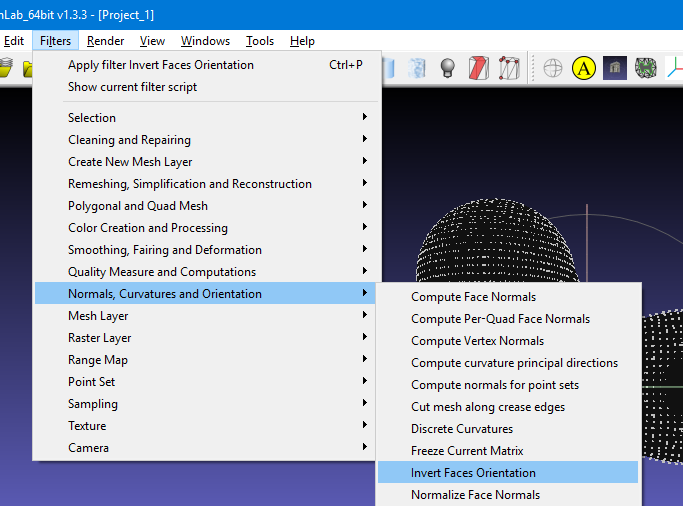 |
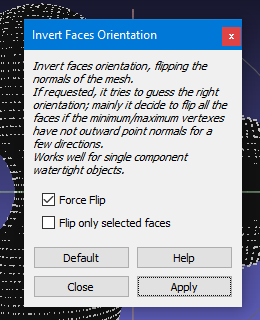 |
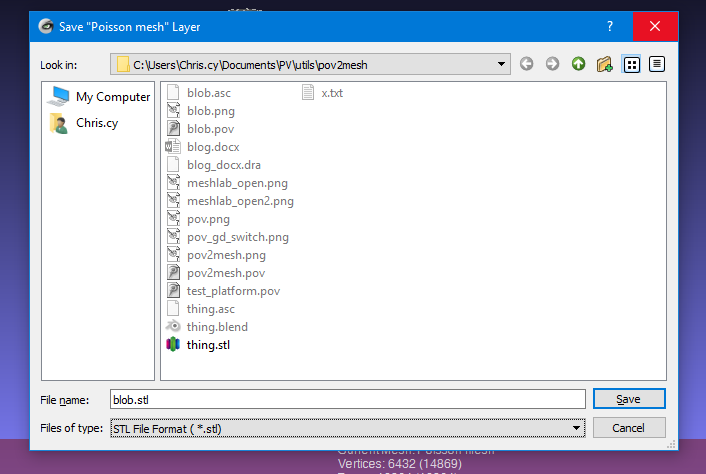
Finally we already to export our newly created mesh as an STL file. On the menu select File-> Export Mesh. Give it a filename and under the Files of type: choose STL File Format.
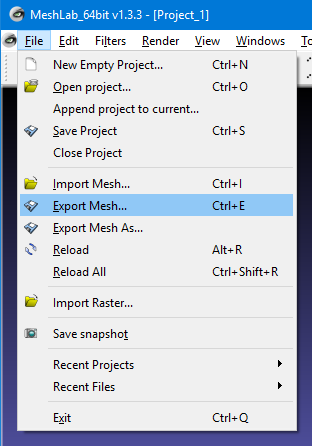 |
 |
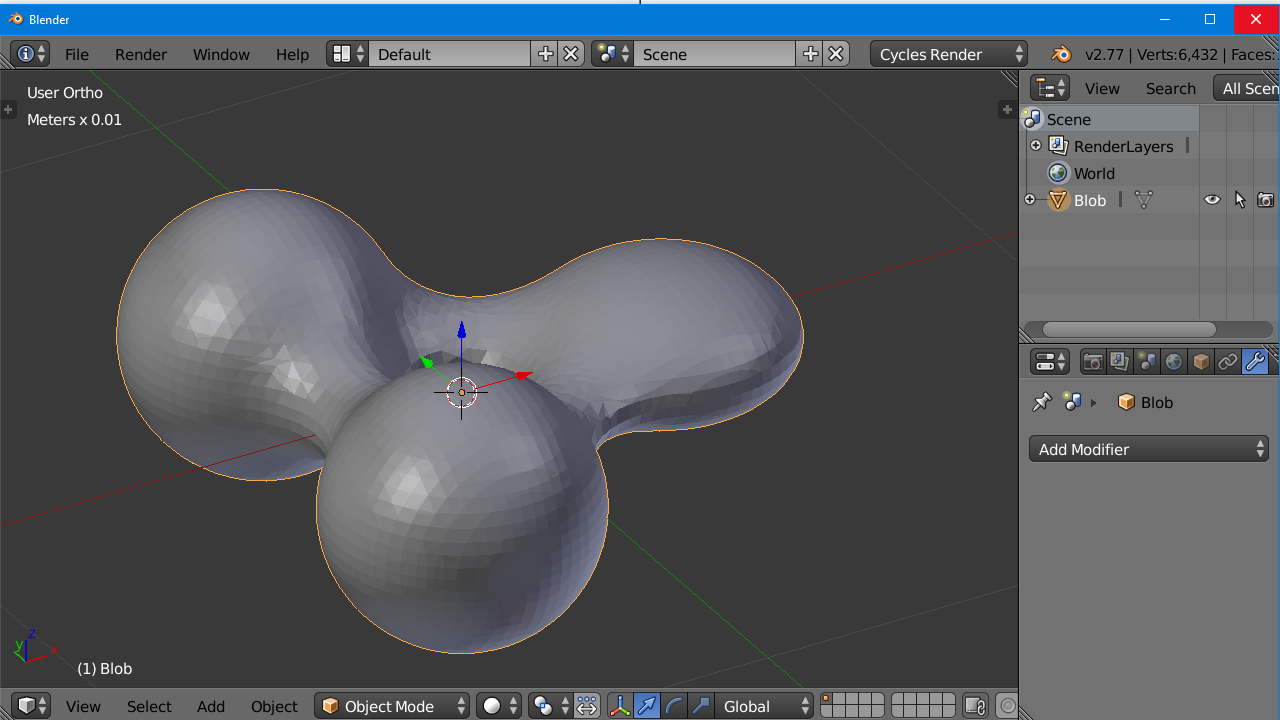
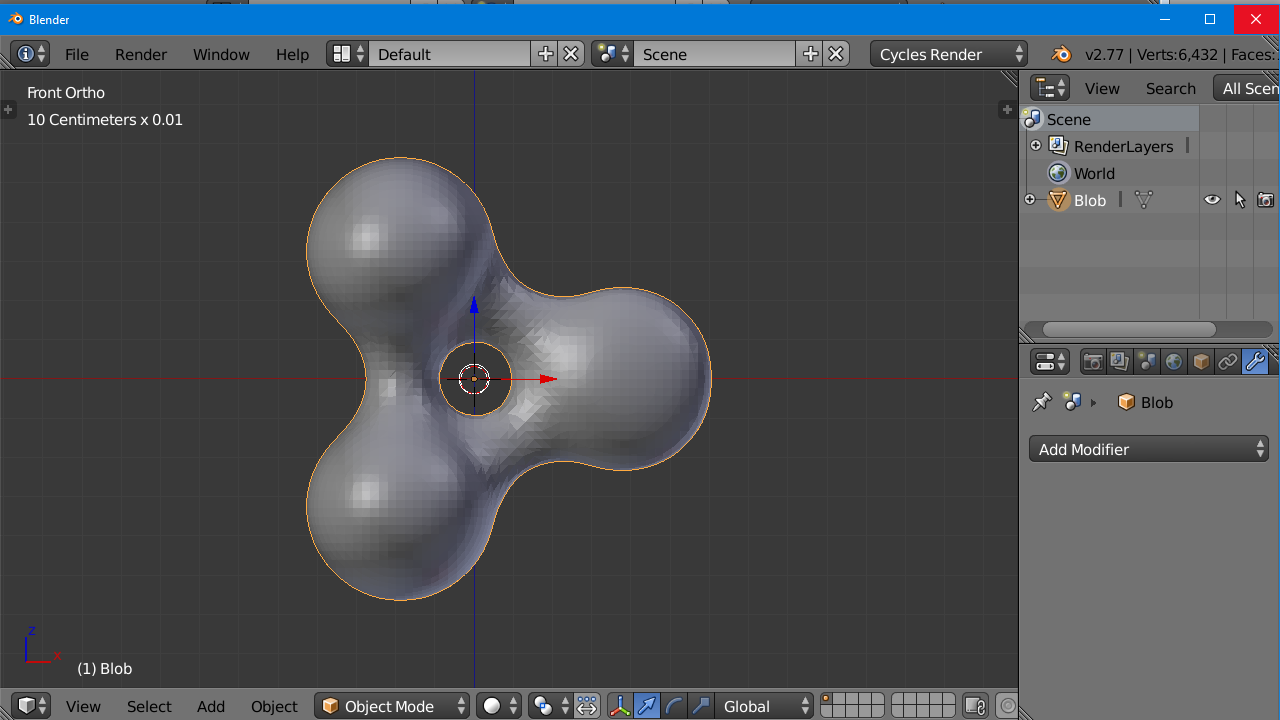
Many CAD programs and 3-D printing slicing software can import and manipulate and print STL files. We like to use Blender 3D for editing files and designing models. You can obtain it at https://www.blender.org/ We’re not going to go into any detail on how to use Blender because there are plenty of online tutorials available especially on YouTube. Also you may be using other software. In Blender balance to you can click on the menu File-> Import-> STL format. You’ll probably notice that your object is not in the orientation that you expected.
That is because the POV Ray coordinate system has the y-axis pointing upwards and the z-axis pointed into the screen. Most CAD programs have the y-axis pointing away from you and the z-axis pointing upwards. So you may have to rotate and/or mirror flip to get your object oriented properly.
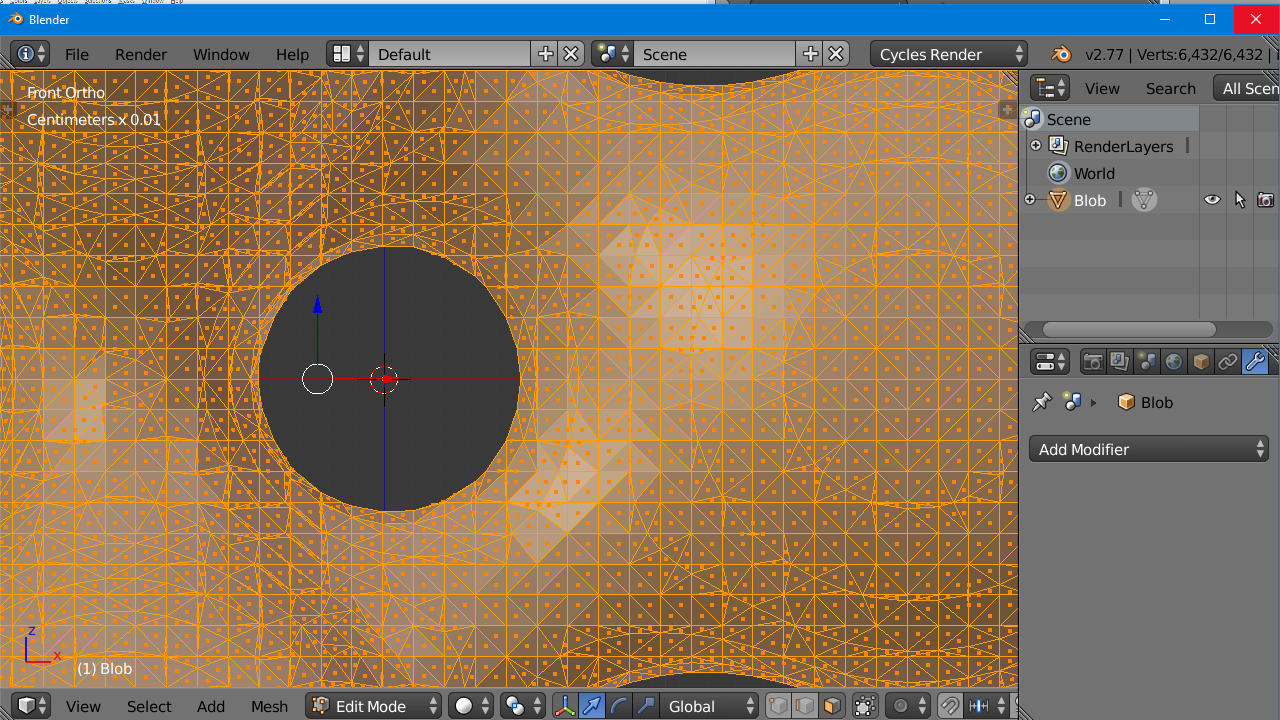
Here is what the object looks like in edit mode so that you can see the individual triangles. You may want to use a decimation modifier to reduce the number of triangles in relatively smooth areas while retaining detail in areas with tight radius.
Unless you use extremely small increments, you may lose detail in converting your object. Sharp edges are never going to be completely sharp using any scanning method. You may have to do some retouching in another program. This method is really only intended for those bizarre shapes that POV Ray can render that are not available in other CAD programs.
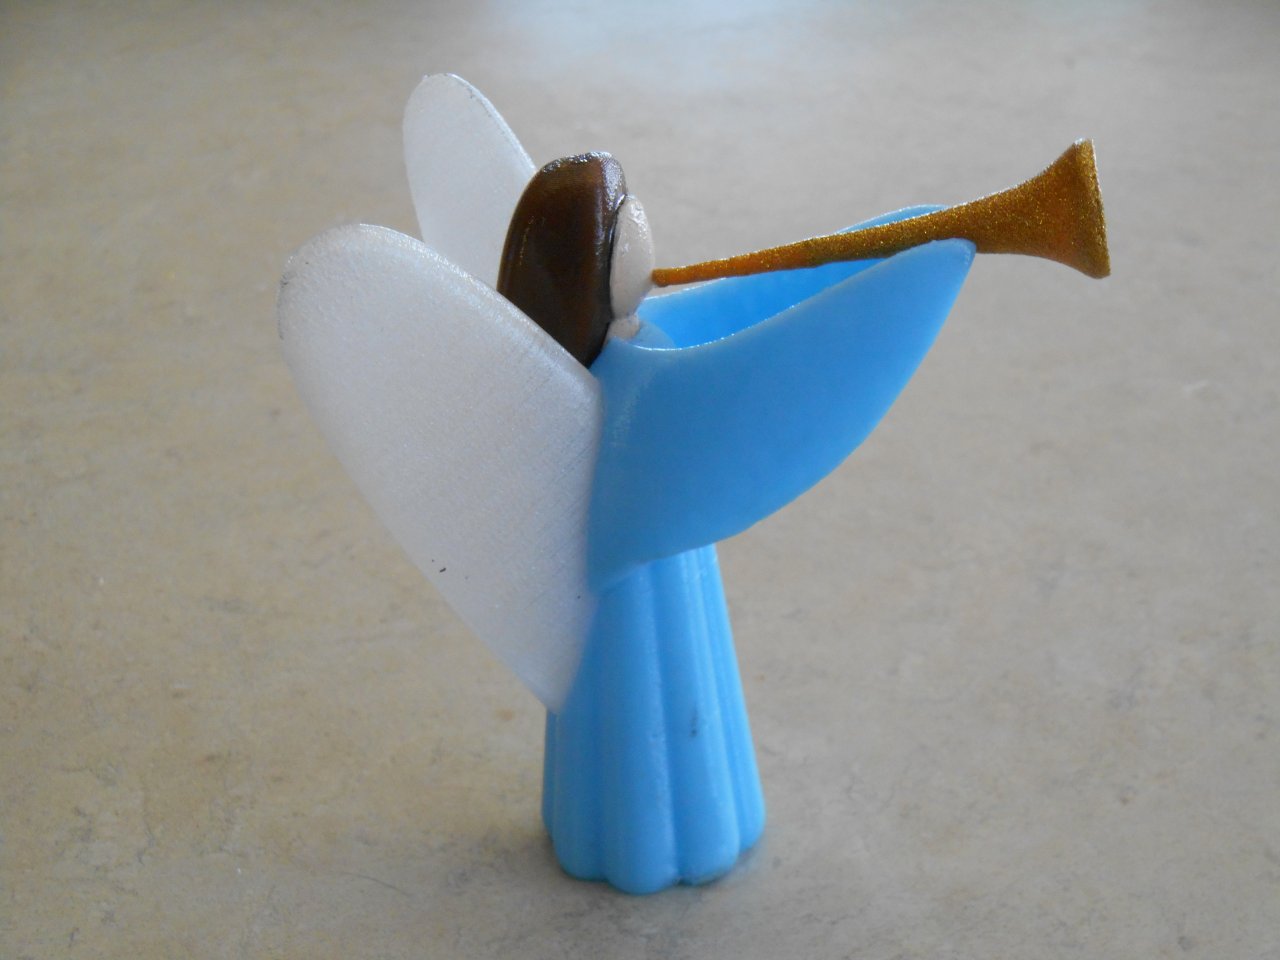
Here is a link to another article describing how I used this software to 3-D print a POV-Ray object that I created many years ago. It includes a YouTube video that shows an animated depiction of how the scanning process works.
You can import the normals into MeshLab using the PLY file format instead of ASC. The format is very similar:
ply
format ascii 1.0
element vertex
property float x
property float y
property float z
property float nx
property float ny
property float nz
end_header
…
Unfortunately, you need to specify a point count before the points, which you can’t do in POV-Ray, obviously, but I just put 0 in and edit it by hand afterwards. I used your trace function as an inspiration and wrote my own that counts the points as it goes then reports the count at the end.
Aargh, forgot about html formatting. After “end_header” is the list of points:
<x1> <y1> <z1> <norm_x1> <norm_y1> <norm_z1>
<xn> <yn> <zn> <norm_xn> <norm_yn> <norm_zn>